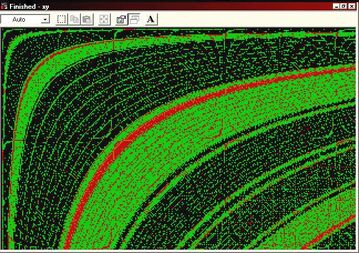
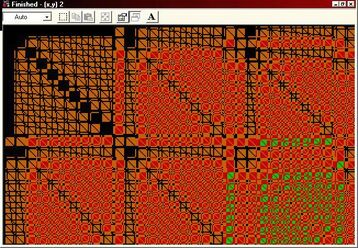
These images are motivated by ideas like those discussed in the paper "Numbers Without Ones" cited above. More specifically they are plots in which each point (x,y) is colored according to the number of occurrences of the digit one in some function f(x,y). In the the image to the left f(x,y)=x2+y2. In the image below left f(x,y)=xy and in the image on the right f(x,y) is the number formed by concatenating (the base-10 representation of) x and y. For reasons mysterious to me, the images seem to contain many smaller duplicates of themselves. The one on the left contains little circles and the one on the right contains little hyperboles.
These images are motivated by ideas like those discussed in the paper"Numbers without Ones" cited above. More specifically they are plots where the color at (x,y) depends on the number of occurrences of the digit one in f(x,y). In the image on the left side f(x,y)=x2+y2. On the bottom left f(x,y)=xy and on the bottom right f(x,y) is the number obtained by concatenating (base-10 representations of) x and y. For reasons mysterious to me, the larger shapes appear to contain smaller copies of themselves, i.e., there are small circles in the figure to the left and small hyperboles in the figure below.
|
|
